Series Overview
I spent over 25 years performing computer simulations of groundwater flow and contaminant transport. These simulations estimated the future movement of contaminants under natural and stressed conditions as we worked on remediating the environment. Billions of dollars have been spent on the remediation of water supplies in the US alone and I was very lucky to have had such a fantastic career.
Eventually, I found myself becoming jaded while doing this work. The reason for this is that I realized one important aspect of my work. I learned first-hand that all models are wrong. The primary skill I tried to develop as a modeler was learning how to minimize the incorrectness of my characterization work and the assumptions I used in the models.
In other words, I wanted to build the most accurate models I could because I wanted to be proud of my work. One problem is that a lot of time is needed to judge the accuracy of any model of this type. Another problem is that Mother Earth is full of complexity, uncertainties, and variation. Additionally, the governing equations that describe the physical processes we are trying to simulate are simplified so that we can solve them with initial conditions, boundary conditions, and discretized regions.
Since we cannot peer into the earth to gain a clear vision of what exists, it impossible for us to accurately simulate conditions in the subsurface. Once we build models, we hope we are right but we realize that we are probably wrong in many regards. Click here to see an example of what I mean.
With that as a background, I have found myself peering into a hornet’s nest that has a sign hanging above it that says “global warming in progress, enter at your own risk”. I don’t want to enter the nest because there are a lot of nasty insects that are continually on guard, waiting to sting whoever decides to enter their territory. These insects are the human zealots that spend much of their time arguing and slamming each other over the state of our atmosphere.
We have a dichotomy in our scientific community that includes global warming believers and skeptics. Each school of thought interprets data differently. One school believes that human activities such as the burning of fossil fuels are causing global warming by loading the atmosphere with CO2, based on the obvious and consistent signs we see across the earth. The other school believes that the multitude of feedback mechanisms that seem to keep the earth’s climate relatively stable over long time periods will limit future temperature increases.
Members of both schools of thought are highly intelligent, passionate, and have developed their perspectives over the past few decades. There are convincing arguments on each side of the fence. Sometimes I feel like a fish out of water, flip-flopping all over the ground as I study this topic by listening to the experts from both the believers and the skeptic sides of the fence.
One thing is for certain: only time will tell who is right. Maybe the truth lies somewhere in between their predicted outcomes. This reminds me of my groundwater modeling days because nonlinearities and uncertainties also abound in climate models like they do in groundwater models. Luckily I never really had to deal with the same degree of scrutiny and infighting as the climate scientist do, except for when I had to present groundwater results to the highly-educated people living in Cape Cod.
Therefore, I have decided to do what I know best. I have decided to process and evaluate weather data. I wanted to see for myself how much actual global warming has occurred, where it has occurred, and whether or not the data is consistent with the observed changes we see across the earth. Since I am not educated in climatology, meteorology, or atmospheric sciences, I do not try to explain why any detected changes are happening. I do not want to offer any opinions as to whether these changes are man-made or within the bounds of natural climate variation. I’ll leave those insights to the experts to define and defend.
Finally, I am an inhabitant of this beautiful planet, and I know based on 50+ years of experience that change is in the air. Air temperature changes are a certainty and I don’t need to do any stochastic modeling to prove what I know based on the contact of my skin with the atmosphere. Are things good or bad? Are the changes acceptable? Will we be able to adapt? Only time will give us those answers.
As a father of a beautiful and intelligent five-year-old boy, I am motivated to do this work on my own time, with my own energy, to help understand what the hell is going on and what we can do about it. I want to leave this earth knowing that I paid attention to what I did to the earth with hopes that I can help my son and future generations live long and healthy lives. It is incumbent upon all of us to pay attention to what is happening and to do our best to understand what the changes might look like fifty or one-hundred years from now.

This is my 5-year-old, blonde-haired, blue-eyed, white skin son. I named him Jett Black, which is completely opposite of his composition. He will be a man of the world, a leader and a highly-intelligent person capable of doing great things. It is my mission to leave him an earth that he can enjoy and be proud of.
If we determine things are going bad, we need to kick ourselves in the ass and do something about it. One thing is for certain, the US president, Donald the Chump Trump will not lead us in the right direction. He is a scientific moron.
The Articles
In the Beginning (2012)
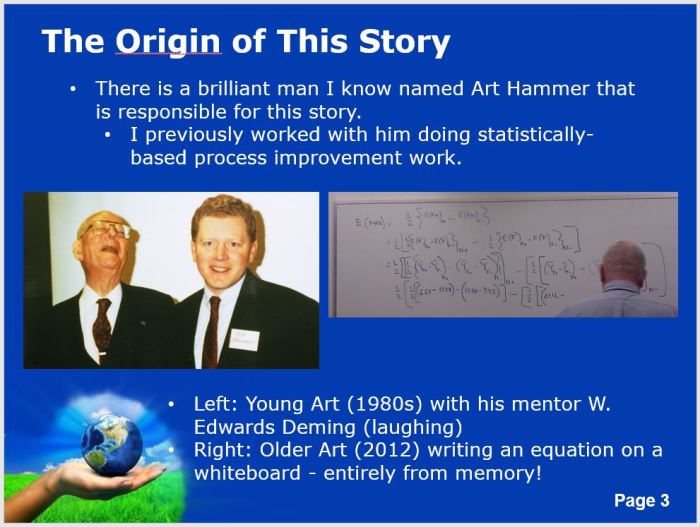
There are three figures (Figure 1-3) that set the stage for all the work I have done on this topic.

Figure 1 – Art Hammer and his mentor, the late great W. Edwards Deming. Art is a world-class intellect, story-teller, and is a person born with a brain that very few people possess. I am lucky to have met him, been taught by him, and to be able to consider him my friend.

Figure 2 – Try as I might, I cannot pinpoint where we were when Art and I had this conversation. It might have been in Houston or Plano, TX, but no matter where it was it planted a seed directly in the center of my brain that has grown into a series of stems that are branching out in multiple directions. I want to thank Art for motivating me to use my skills to attack this problem with vigor, sensibility, and an unbiased attitude.

Figure 3 – Have you ever wondered what causes you to perform work when nobody is watching you or paying attention to what you are doing? I have done that and now I know the answer because of this multi-year project. If you want to know the answer, just ask me.
Phase I (2014) – My Alteryx Manifesto
When I first started learning Alteryx, I wanted to give myself a grand challenge. I wanted to give a gift to college professors that are teaching analytics. I wanted to create a project that could be emulated within a semester, using great software like Alteryx and Tableau. I wanted to design and complete a full-spectrum analytics project that could serve as a teaching tool and one in which would educate our students. I believe I have accomplished this by developing my “Alteryx Manifesto”.
I started the work in late 2014 and I first documented the preliminary work in a series of five articles in early 2015. These articles explain in detail how components of daily weather data can be accessed, processed in Alteryx, and visualized in Tableau. With easily over 100 hours of work invested in this series of articles, it was a great reference for me to be able to continue the work a couple of years later. You can access the articles by clicking the blue text.
- Part 1 – Project Introduction
- Part 2 – The Source of Climate Data
- Part 3 – Reading Weather Station Data
- Part 4 – Alteryx Workflow Details For Reading Data
- Part 5 – Using Tableau To Examine Texas Temperature and Precipitation Data
Phase II (2016-2017)
After moving to Texas and then back to Tennessee and Georgia, I finally found some time to revisit this work. After a couple of years of record high temperatures, I decided to attack this work with renewed enthusiasm. The following articles are the result of this work.
- Investigating Global Climate Change
- Uncovering Surprising Temperature Changes
- Visualizing Worldwide Air Temperature Changes
- Visualizing Warming and Cooling Patterns in North America
- Descriptive and Predictive Study of North American Air Temperature Changes
- Do You Live In An Area Impacted By Global Warming?
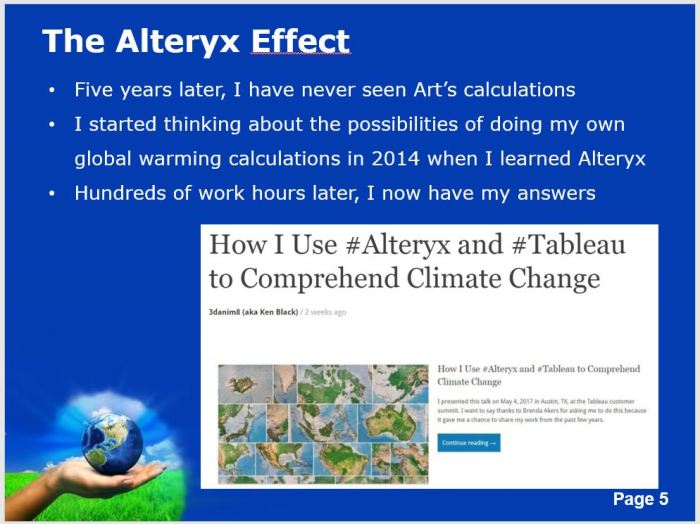
- How I Use Alteryx and Tableau to Comprehend Climate Change
- How To Achieve Better Data Comprehension (Climate Case Study)
- My 2017 Alteryx Inspire Climate Change Presentation
- Global Climate Data Set 1 – Daily Temperatures
- Global Climate Data Set 2 – Monthly and Decade Average Temperatures
- Temperature Changes Over the Past 50 Years: A Visual Tour Country by Country
- Buckled Roads and Melting Permafrost in Bethel, Alaska
Interesting and Thought-Provoking Articles on Climate Change
- Antarctica – be sure to watch the 25-minute documentary
- Melting Permafrost and Explosions in Siberia
- Massive Iceberg Could Split From Antarctica
- The Uninhabitable Earth
- Massive iceberg breaks away from Antarctica
- Sixth mass extinction: The era of ‘biological annihilation’
- Earth to warm 2 degrees Celsius by the end of this century, studies say
- The Year 2016 is Confirmed As Hottest Ever
- The Data School Uses EXASOL to Allow Students To Investigate Daily Temperatures
- A stunning time series animation of Arctic sea ice conditions
Interesting and Thought-Provoking Videos on Climate Change